
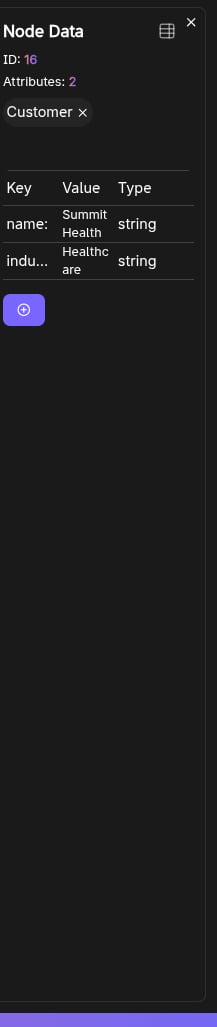
What it shows
For the selected element:- ID
- Attributes count
- Labels (nodes) or Relationship type (edges)
- A properties table (key/value) for viewing and editing attributes
Node label management
For nodes (and when the user role is not Read-Only):- Add Label
- Remove Label (except the “default” empty label)
- The in-app graph model
- The visible canvas node styling
- The graph info panel counts/listing
Editing properties
Properties are managed via the embedded table component. Typical operations include:- Editing existing values
- Adding/removing properties
Keyboard shortcut
Esccloses the Data panel.
Frequently Asked Questions
How do I open the Data panel?
How do I open the Data panel?
Select a node or edge on the graph canvas by clicking it. The Data panel opens automatically to show the element’s properties.
Can I edit node labels from the Data panel?
Can I edit node labels from the Data panel?
Yes. For nodes (when you are not a Read-Only user), you can Add Label or Remove Label directly from the Data panel. Changes are reflected immediately on the canvas.
How do I close the Data panel?
How do I close the Data panel?
Press Esc on your keyboard or click elsewhere on the canvas to deselect the element.
What information does the Data panel show?
What information does the Data panel show?
It displays the element’s ID, attributes count, labels (for nodes) or relationship type (for edges), and a properties table with all key/value pairs.