
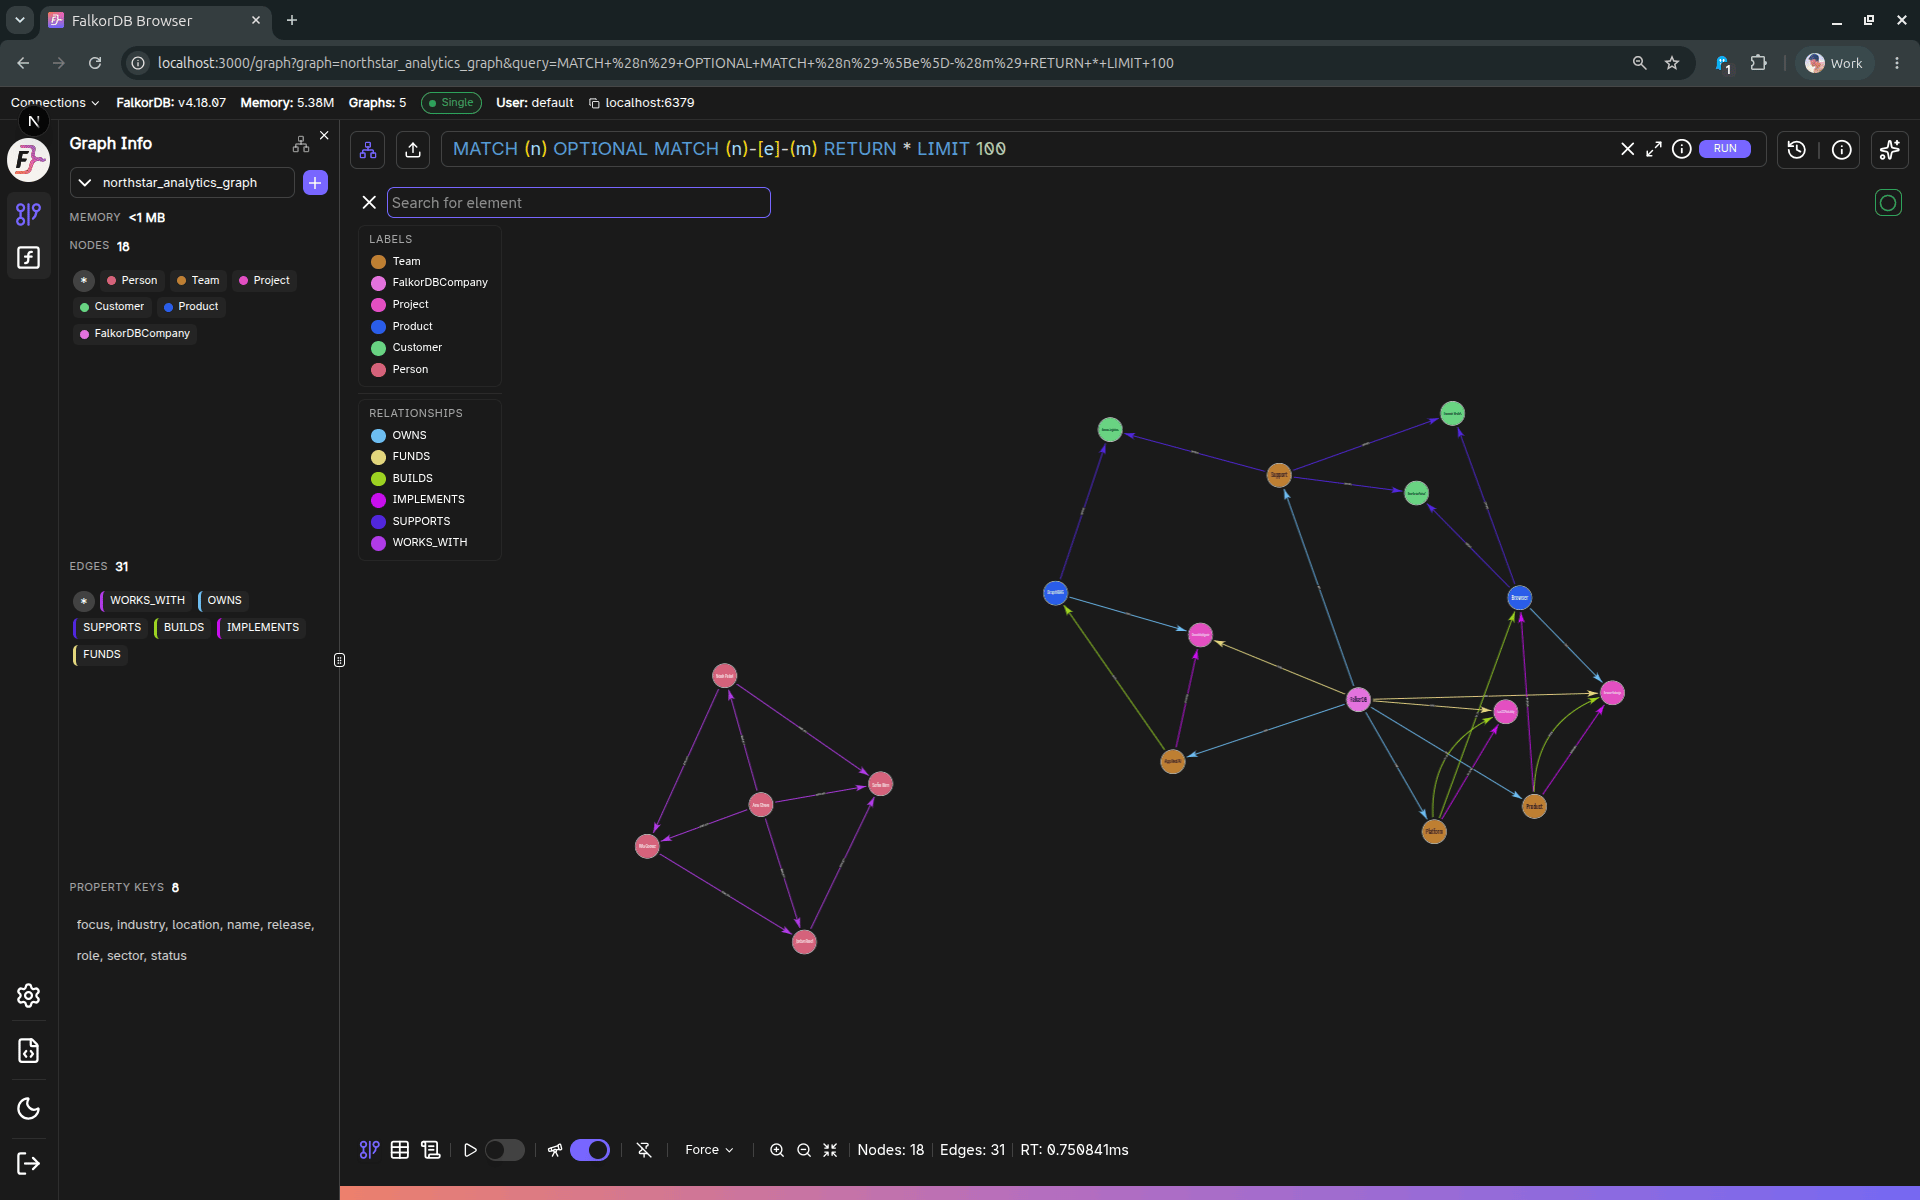
UI elements
For detailed documentation of each major UI element (login, settings, graph canvas, panels, query editor/history, table view, etc.), see:Canvas Component
FalkorDB Canvas is the standalone web component that powers the graph visualization in FalkorDB Browser. It can also be used independently in any web application.Main Features
Use these focused pages for detailed coverage without duplication:Frequently Asked Questions
How do I access FalkorDB Browser?
How do I access FalkorDB Browser?
FalkorDB Browser is a web UI accessible at port 3000 by default. It is included in the main FalkorDB Docker container and is also available through the Cloud service.
What connection URLs does FalkorDB Browser support?
What connection URLs does FalkorDB Browser support?
The Browser supports
falkor://, falkors://, redis://, and rediss:// URL formats for connecting to a FalkorDB server.Can I export my graph data from the Browser?
Can I export my graph data from the Browser?
Yes. Navigate to graph management, select a graph, and click Export Data to download a
.dump file via the /api/graph/:graph/export endpoint.What query language does FalkorDB Browser use?
What query language does FalkorDB Browser use?
FalkorDB Browser uses Cypher as its query language. The built-in Monaco editor provides keyword autocompletion and syntax highlighting.
Is there an API documentation page built into the Browser?
Is there an API documentation page built into the Browser?
Yes. A built-in Swagger UI is available at
/docs which loads the OpenAPI spec from /api/swagger and supports interactive ‘Try it out’ requests.